Built for home daycare owners
Make every daycare spot count.
Know what to charge, how your week is really being used, and which enrollments make the most sense for your business.
- One-time purchase
- No monthly subscription
- 30-day money-back guarantee
Not another daycare management system. Keep the software you already use to run your daycare. DaycareWorth works alongside it and helps with the business decisions behind it.
Best schedule to fill next: Tue + Thu
What an average full-time spot needs to earn here to cover costs and the owner's income goal.
A Tue/Thu family at $190/week
The part nobody trained you for
Running a daycare is one thing.
Knowing if the numbers work is another.
You already know the children, the routines and the families. The harder questions are the business ones — and they usually get answered by gut feel, late at night, on a piece of paper.
DaycareWorth puts a clear calculation behind each one, using your own numbers.
“Am I charging enough?”
Tuition & Rates“Do I really have room for another child?”
Weekly Capacity“Should I accept this part-time schedule?”
Part-Time Decision“What happens to my income when a child leaves?”
Forecast“Which of my current spots are underpriced?”
Rate Audit“Could an assistant actually pay for itself?”
Scenarios
01 — Make more money
Stop guessing what to charge.
What other providers charge in your area is useful context. It is not an answer. The rate that matters is the one your own daycare needs to earn.
DaycareWorth works backward from your operating expenses, your income goal, your licensed capacity and the weeks you stay open — and shows the number along with the math behind it.
- Tuition Rate Builder with a sustainable weekly target
- Rate Audit across every current enrollment
- Break-even and expense pressure analysis
- Tuition Increase Planner with a parent notice draft
Sustainable rate, step by step
Samplespread across 6.8 filled spots at 85% average occupancy
Then it checks the spots you already have
Every enrollment compared against that target — no child names required.
- Child A5 days · target $291/wk$325+$34/wk
- Child B5 days · target $291/wk$245−$46/wk
- Child C5 days · target $291/wk$300+$9/wk
- Child D5 days · target $291/wk$310+$19/wk
- Child E3 days · target $175/wk$200+$25/wk
- Child F3 days · target $175/wk$210+$35/wk
02 — Make every spot count
Your licensed capacity isn't your real weekly capacity.
“Eight spots” is a number on a certificate. What you actually sell is seat-days — a spot, on a specific day. Part-time schedules leave gaps that never look like an empty chair, because the chair is full on Monday.
Licensed capacity, 5 operating days
8 spots × 5 days each week
65% of the week — 14 still open
Where the open days actually are
Sunshine Family Child Care · sample daycare
Mon, Wed and Fri are nearly full. Tue and Thu are half empty.
This daycare doesn't have “two open spots.” It has 14 unsold seat-days, and they sit on two specific weekdays. That changes which family is worth calling back first.
14 unsold seat-days valued at this daycare's own target of $58 per seat-day. An estimate of available capacity — not a revenue projection, and not a promise of enrollment.
03 — Better enrollment decisions
An open spot isn't the whole story.
Two families call in the same week. One wants Tuesday and Thursday. The other wants Monday, Wednesday and Friday, and offers more money. Which one should you take?
Both look profitable. They are not equally good — because of what each one does to the rest of your week.
Tuesday & Thursday
Offering $190 per week
This schedule fills your least-used weekdays and balances weekly capacity.
- Base target (2 days)
- $116
- Part-time premium (15%)
- +$17
- Fragmentation (0%)
- +$0
- Recommended planning target
- $134
Fills your two emptiest days and leaves the week evenly loaded.
You could still take 2 full-time children after saying yes.
Mon / Wed / Fri
Offering $285 per week
This schedule uses high-demand days while leaving other days open.
- Base target (3 days)
- $175
- Part-time premium (15%)
- +$26
- Fragmentation (5%)
- +$9
- Recommended planning target
- $210
Takes your three busiest days and strands 8 seat-days on Tue and Thu.
You could still take 1 full-time child after saying yes.
The bigger offer is the one that costs you more room. Mon/Wed/Fri brings in $95 more a week and leaves you able to take 1 more full-time child instead of 2. DaycareWorth puts that trade-off in front of you before you reply — including a suggested counter-offer when a schedule is worth taking at a different rate.
What's inside
Four questions, answered properly.
Every tool in DaycareWorth exists to answer one of these. Nothing in it is a feature looking for a reason.
What your daycare needs to earn
Build a rate from your own costs and income goal, then check every spot you already have against it.
- Tuition Rate Builder
- Rate Audit per enrollment
- Break-even analysis
- Expense pressure test
- Income goal planning
- Tuition Increase Planner
Where your week has room
See capacity as seat-days, spot the gaps part-time schedules leave behind, and judge a schedule before you commit to it.
- Weekly Capacity Map
- Part-Time Decision Engine
- Schedule fit & fragmentation
- Vacancy & potential tuition capacity
- Waitlist Fit Matcher
What next year looks like
Model departures, rate changes and staffing before they happen, instead of reacting after.
- 12-month capacity forecast
- Scenario Simulator
- Assistant & expansion simulator
What to do about it
A ranked list of what deserves attention, and a report you can actually hand to someone.
- Action Center with ranked priorities
- Coming Up alerts
- PDF business report
- Multi-currency support
How it works
Set it up once. Use it every time a decision comes up.
- 1One-time setup
Add your daycare numbers
Licensed capacity, operating days, expenses, and what you want to earn. No child names, no accounting background, no spreadsheet formulas.
- 2Updates as you edit
See what deserves attention
DaycareWorth flags underpriced spots, unsold days, fragmented schedules and what changes next quarter — ranked, not dumped on you.
- 3Whenever a decision comes up
Decide with the numbers in front of you
Set a rate you can explain. Answer a part-time family the same day. Test an assistant, a price increase or a departure before it happens.
No account, no email — the preview runs on the same engine you get after purchase.
Where it fits
Not another daycare management system.
Keep the software you already use to run your daycare. Use DaycareWorth to make better business decisions.
Runs your day
- Billing & invoicing
- Attendance & check-in
- Parent messages & photos
- Daily operations & reminders
You already have this. Keep it.
Runs your numbers
- Tuition decisions
- Capacity & schedule fit
- Enrollment decisions
- Profit scenarios & forecasting
- Business planning
This is the business-decision layer your daycare software may not be built to handle.
Run your daycare with the software you already use.
Make better business decisions with DaycareWorth.
DaycareWorth works alongside your existing daycare software — it doesn't replace it.
Product preview
Move the numbers yourself.
This is the real DaycareWorth engine running on a sample home daycare — eight licensed spots, six children, an uneven week. No account, no email, nothing saved.
Weekly capacity by day
Monday through Friday, 8 spots per day
Tue + Thu carry the most open capacity. Prioritizing waitlist families who need those days balances the week instead of crowding it.
Your daycare. Your numbers. Your decisions.
Same engine, running on your own tuition, capacity, schedules and goals.
Free estimator
What is one empty spot worth?
Put in your own numbers. Nothing is saved, nothing is sent, and no email is required.
Your daycare
1 spot over 4 weeks
A simple estimate from the values you entered. Enrollment and revenue are not guaranteed.
New · 86-page digital playbook
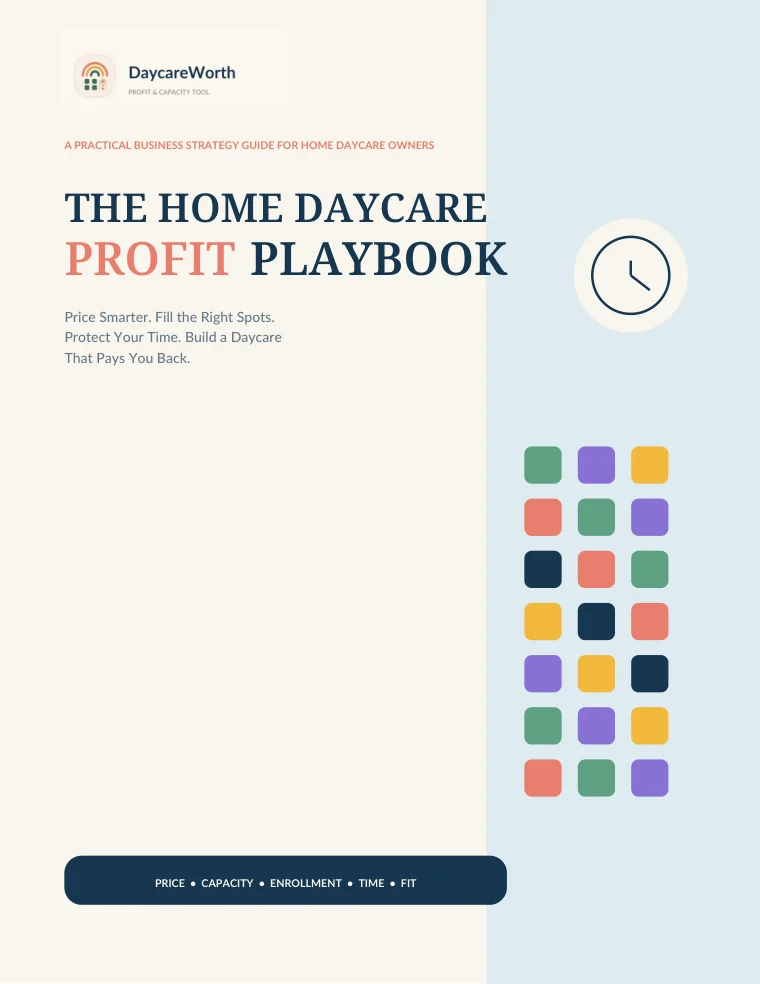
The Home Daycare
Profit Playbook
Price Smarter. Fill the Right Spots. Protect Your Time. Build a Daycare That Pays You Back.
Most home daycare owners were taught how to care for children — not how to decide what a spot is worth, when a rate is too low, whether a part-time family makes sense, or what all those invisible hours are really costing.
The Home Daycare Profit Playbook turns those questions into practical business decisions.
86 pages · 15 chapters · Premium digital PDF · One-time purchase · 30-day money-back guarantee
You don't necessarily need a bigger daycare.
You need a daycare that works better.
Do any of these sound familiar?
“I charge what other daycares charge.”
“I have an empty spot and feel like I need to fill it immediately.”
“I don't know if I can raise tuition without losing families.”
“I think I need another child to earn more.”
“I keep saying yes because I want to be flexible.”
“I work far more hours than my opening hours suggest.”
“I love the children. I'm just tired of the business around them.”
None of these mean you are doing it wrong. They usually mean nobody ever showed you how to price and plan the business side.
Small decisions add up.
The Playbook keeps connecting a weekly decision to its annual size. That is usually where the number stops feeling small.
- $10 more per week
- 6 children
- 48 operating weeks
A small tuition difference can become a meaningful annual gap.
- 10 extra minutes a day
- 5 days a week
- 48 operating weeks
Invisible time is still business time.
- One $325 spot
- Open for 8 weeks
- No replacement family
Unused capacity can become expensive quickly.
Simplified illustrative examples taken from the book. They show the scale of a decision — they are not a forecast, a recommendation of what to charge, or a promise of extra revenue or savings.
5 parts. 15 chapters. One question at a time.
- Is Your Home Daycare Actually Worth It?
- Stop Pricing by Guesswork
- The True Cost of an Empty Spot
- Your Real Working Hours
Closing chapter: Your Daycare Should Work for You, Too.
Look inside.
Real pages from the book — not mockups. Each chapter turns one business question into something you can actually work through.
The 86-page premium digital edition, in full. A separate product from the DaycareWorth software — it works on its own.
One-time purchase · 30-day money-back guarantee
Digital PDF · Download straight after payment
Already bought it? Get your download
What you get
Everything below is part of the $29 purchase.
- Full 86-page PDF
- 15 practical business chapters
- Pricing & tuition frameworks
- Capacity & vacancy strategy
- Enrollment & family-fit decisions
- Time & flexibility analysis
- The Home Daycare Profit Reset
- Interactive table of contents
- Downloadable digital edition
A $29 book doesn't need to change everything to be worth reading. One clearer decision about a rate, an open spot or how much flexibility you give away is usually where the ideas start paying for themselves.
The Playbook is a business strategy guide. It is not legal, tax, licensing, insurance or accounting advice, and it does not guarantee any financial result.
Two products
Two different ways to get more clarity.
The Playbook
Understanding the strategy.
Read the frameworks behind pricing, capacity, enrollment, time and family-fit decisions.
One-time purchase · 30-day money-back guarantee
DaycareWorth Complete
Applying the strategy to your own daycare.
Use your actual tuition, schedules, capacity and operating numbers to compare decisions.
One-time purchase · No monthly subscription · 30-day money-back guarantee
The Playbook explains what to look for. DaycareWorth helps you see what it means for your own daycare.
You don't need both. Each one is useful on its own.
Before we talk about price
A single decision can matter more than what the tool costs.
DaycareWorth won't enroll a family for you, and it won't promise you a number. What it does is put the math in front of the decisions you are already making.
One rate you set on purpose
Instead of carrying last year's number forward because nobody sat down to check it.
One schedule you say yes to knowingly
Because you could see what it does to the rest of your week before you answered.
One month you saw coming
A child leaving in the spring is a very different problem in November than in April.
DaycareWorth provides estimates and decision support based on the information you enter. It does not guarantee higher revenue, higher profit or any specific financial outcome, and it is not legal, tax, accounting or licensing advice.
Pricing
One tool. One price. No monthly subscription.
Full access to every tool included in DaycareWorth Complete today — every rate builder, capacity tool, simulator and report.
One-time purchase · No monthly subscription · 30-day money-back guarantee
Already have an account? Log in
30-day money-back guarantee
- 30 days to try it
Use the whole product on your own numbers, not a limited trial.
- Self-service refund
Request it from inside your account. No email thread, no forms.
- No subscription
Pay once. Nothing recurring, nothing to cancel later.
Everything included
Every tool below is part of the $79 purchase.
- Profit & capacity dashboard
- Tuition Rate Builder
- Rate Audit per enrollment
- Weekly Capacity Map
- Part-Time Decision Engine
- Schedule fit & fragmentation
- Vacancy & potential capacity
- 12-month capacity forecast
- Scenario Simulator
- Tuition Increase Planner
- Waitlist Fit Matcher
- Expense pressure test
- Assistant & expansion simulator
- Action Center with ranked priorities
- PDF business report
- Multi-currency support
Privacy by design
Built around your business — not around children's data.
DaycareWorth is a financial tool for the owner. It was designed so you never need to put anything sensitive about the families in your care into it.
No child names required
Every calculation works with labels like Child A and Child B. The math doesn't need to know who they are.
No medical or family records
No immunization records, no addresses, no emergency contacts. DaycareWorth doesn't ask you to store them.
No photos, no messaging, no logs
There is no camera feed, no parent channel and no daily report. That is what your other software is for.
You set your licensed capacity
Licensing rules differ by state and county. You enter the capacity that applies to your program, and every estimate follows it.
No. It does not handle billing, attendance, parent messaging or daily logs, and it is not trying to. It works alongside whatever software you already use to run your daycare, and focuses only on the financial and capacity decisions behind it.
Custom requests · optional
Need something specific for your daycare?
DaycareWorth Complete is ready to use as it is. But every daycare works a little differently — so if there's a calculation or planning problem specific to yours, tell us about it and we'll look at whether it can be built.
- 1
Tell us what you need
Describe the calculation, planning tool or decision you want help with.
- 2
We review the idea
We'll tell you whether it could reasonably be built into DaycareWorth.
- 3
Get a quote
Custom development is optional and quoted separately from the $79 product.
You only have so many spots.
Make each one count.
See where your daycare stands today, what each spot is really worth, and which decisions deserve your attention first.
One-time purchase · No monthly subscription · 30-day money-back guarantee